
Deutschsprachige Beiträge nun Abwechselnd mit Englischsprachigen Beiträgen
In this blog I am discussing the development of SARS-CoV-2 infections according to US-data. (Source: covidtracking.com). There I am mainly focusing on the question, if there are consistent signs of an exponential development of the fraction of positive tests compared to the total number of tests.
Further I will discuss, how the mortality rate, discussed in media, develops and in how far it is applicable at all.
Additionally I will discuss the development of the hospitalization numbers in New York relative to the infection numbers, and show an worrying trend.
Before I start with my article, I am recommending everybody strictly following the instruction given by their governments and physicians with regard to the COVID19-crisis.
First I want to start with the question, in how far the number of positive tests relates to the total number of tests:
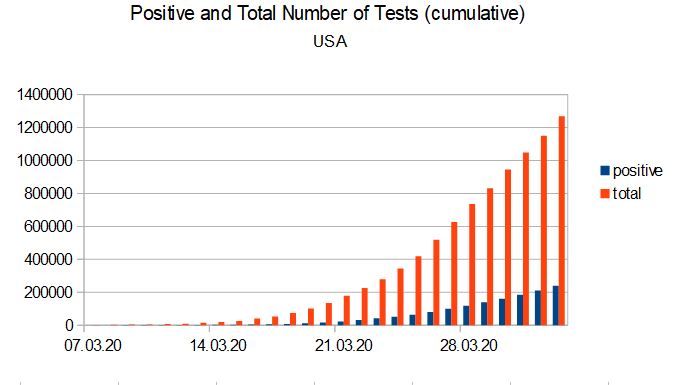
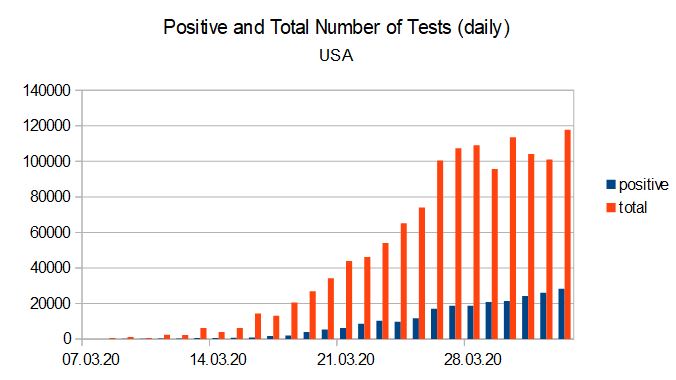
The left figure shows the cumulative development of the number of positive tests and total number of tests. Both developements appear to be of exponential shape, thus correlating to each other. Around the 25th of March, where the total number of tests starts to show a linear increase, the number of positive tests continues to increase exponetially. This is in agreement with the daily numbers. The daily total number of tests is increasing until the 25th of march. Afterwards it fluctuates around 100000. The number of positive tests continues increasing.
It has to be remarked, that there is a general proplem with the number of negative tests, partially the reporting is delayed, sometimes the numbers are not reported at all. To investigate the assumption, that there is a correlation between the number of positive tests, and the total number of tests, I further analysed the data. For better visualizing the correlation, I plotted the ratio of positive tests versus the total number of tests.
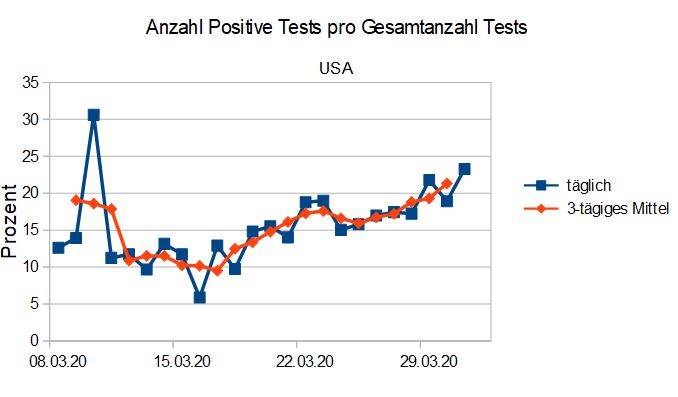
As you see in the figure, there was a slight drop of the ratio beween positive and total tests, while it stayed almost constant between the 11th and 18th of March. Then an increase of the ratio is observed.
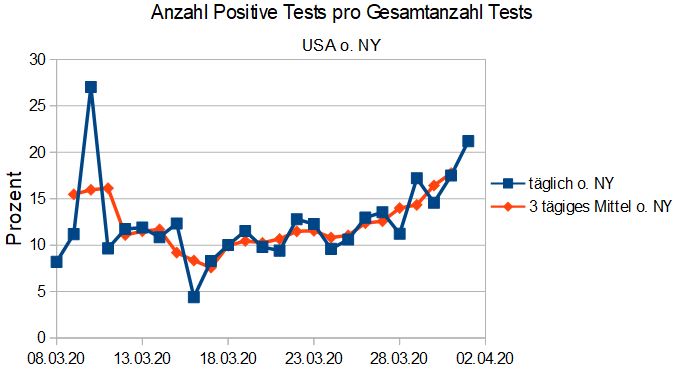
New York is always a problematic for the analysis of the US-data. New York started late increasing its testing, but the increased it massively. Actually it is over-represented, contributing 20-30 % of the tests, while having only 6-7 % of the total population of the US. Since the percentage of positive tests is about the double of the national average, the percentage of positive tests is raising in the figure just for this reason. Additionally New York reported a very low number of negative tests in the last days, indicating inconsistent reporting. Therefore I removed the New York data from the national data (right figure).
As you see from the figure, there is, beside two outsiders on the 10th and 16th of March, an almost flat behaviour between the 9th of March and the 25th of March, showing no change of the precentage of positive tests. From the 26th of March, there seems to be an almost exponential increase of the ratio of positive vs total number of tests.
For better visualizing of this penomenon, I displayed the graph on logaritmic scale:
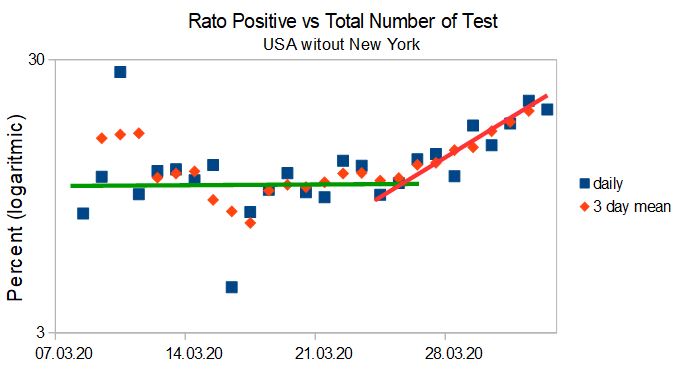
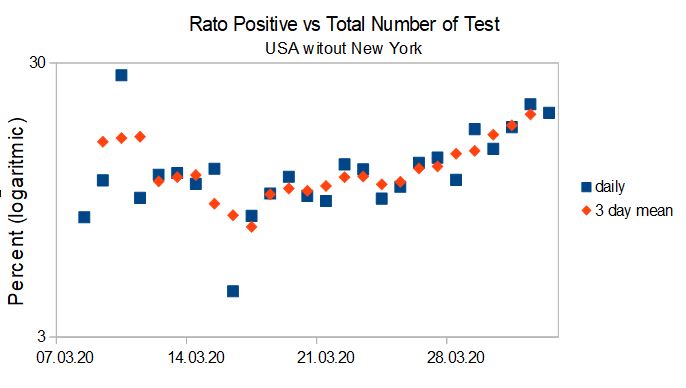
In Fig. 3 I show the ratio between number of positive and the total number of tests on logarithmic scale (left with trend lines, right without, so you can make your own opinion). As you see from the figure, the conclusion drawn before is valid. The flat line between the 8th of March and the 25th of march indicates no exponential behavior. The straigt increase on logarithmic scale after the 26th of March indicates an exponential behavior. As seen from figure 1, the exponential behavior starting from the 26th is caused by the flattening of the development of the total test number, thus, most likely, being a result of inconsistent reporting of negative tests.
In summary, the data analysis indicates, that there is no sinificant change of the ratio between the number of positive and the total number of tests. This gives raise to the assumtion, that the number of people infected with SARS-CoV-2 stays almost constant.
Development of the Mortality Rate
How deadly is the virus. Actually it is the general procedure, to estimate the mortality number from the ratio between deaths and positive tests. This is, following the conclusion made in the chapter in before, absolutely useless. The real number of people infested by SARS-CoV-2 is most likely orders of magnitude higher than the official estimates. Further, the real mortality can be only determined, when the infected finally recover from the disease. Therefore in general, the numbers will be inflated due to the far too low number of infections presumed, and can drop due to increasing test numbers or increase due to progressing time.
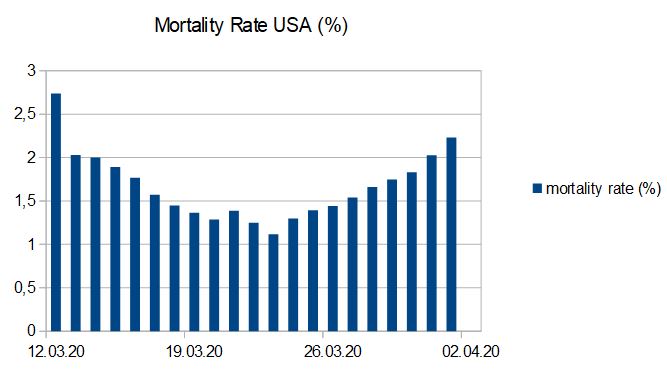
The mortality rate in the USA dropped from about 2,5 % to 1 %, and rose afterwards again to more than 2 %. However, as discussed above, these numbers are completely useless.
Hospitalization
The data presented until now indicated, that the actually observed developments regarding the COVID19-disease are mainly caused by increasing test numbers. The hospitalization is different. If we compare the hospitalization numbers (cumulative) from New York with the positive test numbers, then we see a problematic behavior:
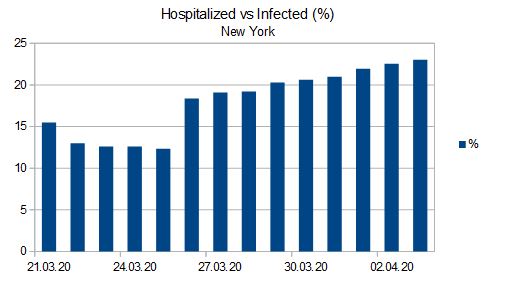
The relative number of hospitalization escalated the 26. of March and continued raising. Actually we see almost a doubling of the relative number. Therefore it is urgently recommended to reevaluate the guidelines for hospitalization, to avoid an overcrowding of the hospitals.
Summary
- A detailed analysis of the ratio between positive tests and the total test number indicates, that the fraction of people infected with SARS-CoV-2 is most likely staying constant or hardly changing since the 9th of March within the US. To evaluate this finding, a statistical study to evaluate the spreading of the SARS-CoV-Virus is highly recommended.
- The hospitalization numbers are increasing faster than the number of positive tested individuals. Therefore it is highly recommended, to evaluate the guidelines for hospitalization, to avois an overcrowding.
